How to Replace Missing Values (NA) in R: na.omit & na.rm
Missing values (NA) occur when observations are not recorded or when values cannot be parsed correctly. Before modeling or summarizing data, you should decide whether to remove missing rows or impute missing values.
In this lesson you will learn how to:
- Identify which columns contain missing values
- Remove rows containing missing values
- Impute missing values using the mean or the median

mutate()
mutate() is one of the core verbs in dplyr. It is useful
to create new variables or modify existing ones.
Basic syntax:
Identify missing values
We will use a Titanic dataset with missing values.
library(dplyr)
library(readr)

path <- "raw_data/test.csv"
df_titanic <- readr::read_csv(path, show_col_types = FALSE)

# Column names containing at least one NA
cols_with_na <- names(df_titanic)[colSums(is.na(df_titanic)) > 0]
cols_with_na
## [1] "Age" "Fare" "Cabin"# Count missing values by column (only those with NA)
na_counts <- sort(colSums(is.na(df_titanic))[cols_with_na], decreasing = TRUE)
na_counts## Cabin Age Fare
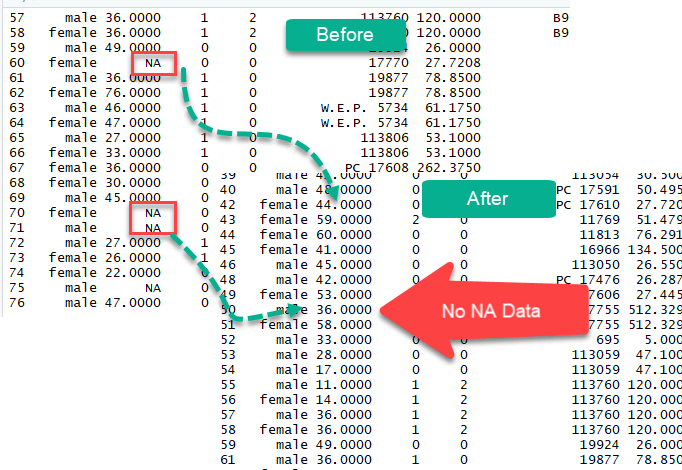
## 327 86 1Exclude missing values (na.omit)
A simple way to remove rows with missing values is
na.omit(). Note: na.omit() is a base R
function (from stats) that removes observations containing
missing values.
## [1] 418 11## [1] 87 11
Impute missing values (mean / median)
Removing rows is easy, but it may discard a lot of information. A common alternative is to impute missing values. Here we show mean and median imputation for numeric columns only.
Step 1: Select numeric columns that contain NA
numeric_cols <- names(dplyr::select(df_titanic, where(is.numeric)))
na_numeric_cols <- intersect(cols_with_na, numeric_cols)

na_numeric_cols
## [1] "Age" "Fare"Step 2: Compute mean/median for those columns
mean_by_col <- sapply(df_titanic[na_numeric_cols], mean, na.rm = TRUE)
median_by_col <- sapply(df_titanic[na_numeric_cols], median, na.rm = TRUE)

mean_by_col
## Age Fare
## 30.27259 35.62719## Age Fare
## 27.0000 14.4542Step 3: Create new variables with imputed values
Using tidyr::replace_na() is a clean way to replace NA
values with a constant. Combined with dplyr::across(), it
scales to many columns easily.
library(tidyr)

df_titanic_imputed <- df_titanic |>
  dplyr::mutate(
    # Mean imputation: create new columns
    dplyr::across(
      dplyr::all_of(na_numeric_cols),
      ~ tidyr::replace_na(.x, mean(.x, na.rm = TRUE)),
      .names = "impute_mean_{.col}"
    ),
    # Median imputation: create new columns
    dplyr::across(
      dplyr::all_of(na_numeric_cols),
      ~ tidyr::replace_na(.x, median(.x, na.rm = TRUE)),
      .names = "impute_median_{.col}"
    )
  )

df_titanic_imputed |>
  dplyr::select(dplyr::all_of(na_numeric_cols), starts_with("impute_")) |>
dplyr::slice(1:10)| Age | Fare | impute_mean_Age | impute_mean_Fare | impute_median_Age | impute_median_Fare |
|---|---|---|---|---|---|
| 34.5 | 7.8292 | 34.5 | 7.8292 | 34.5 | 7.8292 |
| 47.0 | 7.0000 | 47.0 | 7.0000 | 47.0 | 7.0000 |
| 62.0 | 9.6875 | 62.0 | 9.6875 | 62.0 | 9.6875 |
| 27.0 | 8.6625 | 27.0 | 8.6625 | 27.0 | 8.6625 |
| 22.0 | 12.2875 | 22.0 | 12.2875 | 22.0 | 12.2875 |
| 14.0 | 9.2250 | 14.0 | 9.2250 | 14.0 | 9.2250 |
| 30.0 | 7.6292 | 30.0 | 7.6292 | 30.0 | 7.6292 |
| 26.0 | 29.0000 | 26.0 | 29.0000 | 26.0 | 29.0000 |
| 18.0 | 7.2292 | 18.0 | 7.2292 | 18.0 | 7.2292 |
| 21.0 | 24.1500 | 21.0 | 24.1500 | 21.0 | 24.1500 |
Check that imputation worked
# Example check: if Age exists in the data
if ("Age" %in% names(df_titanic_imputed)) {
  c(
    missing_original = sum(is.na(df_titanic_imputed$Age)),
    missing_mean_imp = sum(is.na(df_titanic_imputed$impute_mean_Age)),
    missing_med_imp  = sum(is.na(df_titanic_imputed$impute_median_Age))
  )
}
## missing_original missing_mean_imp missing_med_imp
## 86 0 0na.rm
When computing statistics on vectors with missing values, you often
need na.rm = TRUE (e.g.,
mean(x, na.rm = TRUE)) so that missing values are
ignored.
Summary
| Library | Objective | Code |
|---|---|---|
| Base (stats) | Remove rows with NA | stats::na.omit(df) |
| Base | List columns with NA | names(df)[colSums(is.na(df)) > 0] |
| dplyr + tidyr | Impute NA (mean/median) | df |> mutate(across(cols, ~replace_na(.x, mean(.x, na.rm=TRUE)))) |
A work by Gianluca Sottile
gianluca.sottile@unipa.it