library(dplyr)
library(ggplot2)
library(psych) # fa(), fa.parallel(), KMO(), alpha(), omega(); needs GPArotation for obliminFactor analysis
Uncover the latent traits behind questionnaire items — and judge whether the model holds
Learn the factor model, how it differs from PCA, how to check factorability, choose the number of factors, use polychoric correlations for Likert items, rotate obliquely, read loadings and fit indices, and assess reliability with alpha and omega.
NoteLearning objectives
By the end of this lesson you will be able to:
- explain the factor model \(X = \Lambda F + \varepsilon\) and how it differs from PCA (common vs total variance);
- check whether data are suitable for factor analysis (KMO, Bartlett) and choose the number of factors with parallel analysis and theory;
- fit an exploratory factor analysis with
psych::fa()using polychoric correlations and an oblique rotation; - interpret loadings, communalities, uniquenesses, factor correlations and fit indices;
- compute factor scores and the reliability of a scale (Cronbach’s α, McDonald’s ω), handling reverse-keyed items.
1. Why factor analysis?
Personality questionnaires ask things like “I am the life of the party” or “I get stressed out easily” on a 1–6 scale. Nobody cares about any single item for its own sake. We care about the traits behind them — extraversion, neuroticism — which we cannot measure directly. Such unobservable quantities are called latent variables (or factors).
The idea of factor analysis (FA) is:
Items that are answered similarly by the same people are probably driven by a common cause. If we can explain the correlations among many items with a few latent factors, we have found the structure of the questionnaire.
FA answers questions like: How many traits does this questionnaire measure? Which items belong to which trait? Are the traits correlated? How much of each item is “trait” and how much is noise?
2. The factor model, and how it differs from PCA
Each observed (standardised) item is modelled as a weighted sum of a few common factors plus a part that is unique to that item:
\[ \text{item}_j \;=\; \lambda_{j1} F_1 + \lambda_{j2} F_2 + \dots + \lambda_{jm} F_m \;+\; \varepsilon_j . \]
- The \(\lambda\)’s are the loadings: how strongly item \(j\) depends on each factor.
- \(\varepsilon_j\) is the unique part: measurement error plus anything specific to that item.
- The communality \(h^2_j\) is the share of item \(j\)’s variance explained by the common factors; the uniqueness is \(u^2_j = 1 - h^2_j\).
PCA versus FA. PCA (previous lesson) builds components that summarise all the variance of the variables — it has no error term. FA models only the common (shared) variance and sets aside the unique part of each item. The practical consequence: when items contain measurement error, PCA loadings are inflated, while FA tries to recover the “true” loadings.
Let’s see it with simulated data where we know the truth: one latent factor and five items with true loadings 0.8, 0.7, 0.6, 0.5 and 0.4.
set.seed(2025)
n <- 500
f <- rnorm(n)                              # the latent factor
true_load <- c(0.8, 0.7, 0.6, 0.5, 0.4)
items <- sapply(true_load, \(l) l * f + sqrt(1 - l^2) * rnorm(n))
colnames(items) <- paste0("item", 1:5)

fa_1 <- factanal(items, factors = 1)        # base-R maximum likelihood FA
pca_1 <- prcomp(items, scale. = TRUE)

data.frame(
  true = true_load,
  fa   = round(as.vector(fa_1$loadings), 2),
  pca  = round(abs(pca_1$rotation[, 1] * pca_1$sdev[1]), 2)
)
#> true fa pca
#> item1 0.8 0.84 0.84
#> item2 0.7 0.67 0.76
#> item3 0.6 0.56 0.69
#> item4 0.5 0.47 0.61
#> item5 0.4 0.33 0.46The FA loadings are close to the truth; the PCA “loadings” (correlations of items with PC1) are systematically too large, especially for the weak items, because PC1 also absorbs part of each item’s unique noise.
NoteGoing deeper: the covariance structure
With \(p\) items, \(m\) factors, loadings matrix \(\Lambda\) (\(p \times m\)), factor correlation matrix \(\Phi\) and diagonal uniqueness matrix \(\Psi\), the factor model implies
\[ \Sigma \;=\; \Lambda \Phi \Lambda^\top + \Psi . \]
FA estimates \(\Lambda\), \(\Phi\) and \(\Psi\) so that the implied matrix is as close as possible to the observed correlation matrix — by maximum likelihood (fm = "ml", assumes multivariate normality) or by minimum residual / least squares (fm = "minres", the default in psych, no distributional assumption). PCA corresponds instead to decomposing \(\Sigma\) itself, with no \(\Psi\).
The solution is not unique: for any invertible \(m \times m\) matrix \(T\), the loadings \(\Lambda T\) fit the data equally well. Rotation (section 6) exploits this freedom to choose the most interpretable solution.
3. The data: the Big Five inventory
The bfi data in psych contain answers of 2,800 people to 25 personality items (1 = very inaccurate … 6 = very accurate), five items for each of the Big Five traits: Agreeableness, Conscientiousness, Extraversion, Neuroticism and Openness. (If your version of psych does not include bfi, it is in psychTools::bfi.)
# bfi lives in psychTools in recent versions (and in psych in older ones)
bfi_raw <- if (requireNamespace("psychTools", quietly = TRUE)) {
  psychTools::bfi
} else {
  psych::bfi
}

bfi_items <- bfi_raw[, 1:25] |>
  na.omit() |>
  as.data.frame()

dim(bfi_items)
#> [1] 2436 25head(bfi_items, 3)#> A1 A2 A3 A4 A5 C1 C2 C3 C4 C5 E1 E2 E3 E4 E5 N1 N2 N3 N4 N5 O1 O2 O3 O4
#> 61617 2 4 3 4 4 2 3 3 4 4 3 3 3 4 4 3 4 2 2 3 3 6 3 4
#> 61618 2 4 5 2 5 5 4 4 3 4 1 1 6 4 3 3 3 3 5 5 4 2 4 3
#> 61620 5 4 5 4 4 4 5 4 2 5 2 4 4 4 5 4 5 4 2 3 4 2 5 5
#> O5
#> 61617 3
#> 61618 3
#> 61620 2We keep the 2436 people who answered all 25 items. Some items are reverse-keyed: for example, A1 is “Am indifferent to the feelings of others” — agreeing with it means low agreeableness. The reverse-keyed items are A1, C4, C5, E1, E2, O2 and O5 (see psychTools::bfi.dictionary). They will appear with negative loadings.
4. Likert items: polychoric correlations
FA starts from a correlation matrix. Pearson correlations assume continuous variables; Likert answers are ordered categories. Treating “1, 2, …, 6” as continuous numbers attenuates the correlations (makes them smaller), especially when answers pile up at one end of the scale.
The polychoric correlation assumes that behind each ordinal answer there is a continuous, normally distributed “latent response”, cut into categories at certain thresholds, and estimates the correlation between those latent responses. A quick simulation shows the attenuation:
set.seed(31)
z1 <- rnorm(5000)
z2 <- 0.6 * z1 + sqrt(1 - 0.6^2) * rnorm(5000)   # true correlation 0.6
cuts <- c(-Inf, -0.5, 0.3, 0.9, 1.5, Inf)        # 5 answer categories
likert1 <- as.integer(cut(z1, cuts))
likert2 <- as.integer(cut(z2, cuts))

c(latent = cor(z1, z2), pearson_on_categories = cor(likert1, likert2))
#> latent pearson_on_categories
#> 0.6096 0.5460Computed on the categories, the Pearson correlation is 0.55 instead of 0.61. The polychoric correlation recovers the latent value. In psych:
r_poly <- psych::polychoric(bfi_items)$rho
r_pear <- cor(bfi_items)

# polychoric correlations are larger in absolute value
mean(abs(r_poly[lower.tri(r_poly)])) - mean(abs(r_pear[lower.tri(r_pear)]))
#> [1] 0.02537With 6 categories the difference is modest but systematic. With 4 or fewer categories, or very skewed items, it can be large.
5. Is the data suitable? Factorability
Before extracting factors, check that the items share enough common variance.
kmo <- KMO(r_poly)
kmo$MSA                                    # overall KMO
#> [1] 0.8554round(sort(kmo$MSAi)[1:3], 2) # the three weakest items#> A1 O4 N2
#> 0.77 0.78 0.78cortest.bartlett(r_poly, n = nrow(bfi_items))#> $chisq
#> [1] 23262
#>
#> $p.value
#> [1] 0
#>
#> $df
#> [1] 300
TipHow to read this output
- KMO (Kaiser–Meyer–Olkin measure of sampling adequacy) compares correlations with partial correlations. If items share common factors, partial correlations are small and KMO is close to 1. Kaiser’s guide: ≥ 0.90 marvellous, 0.80s meritorious, 0.70s middling, 0.60s mediocre, 0.50s miserable, below 0.50 unacceptable. Here the overall KMO is 0.86. The per-item values (
MSAi) flag items that fit poorly. - Bartlett’s test checks whether the correlation matrix is an identity matrix (no correlations at all). A tiny p-value means “there are correlations” — a minimum requirement. With thousands of respondents it is almost always significant, so it tells you little on its own.
6. How many factors?
Parallel analysis
As in PCA, we compare the observed eigenvalues with those obtained from random data of the same size. fa.parallel() does it for us (here using polychoric correlations, so it takes a little while):
set.seed(2026)
pa <- fa.parallel(bfi_items, fm = "minres", fa = "both", cor = "poly",
                  n.iter = 20, main = "Parallel analysis (polychoric)")
#> Parallel analysis suggests that the number of factors = 6 and the number of components = 5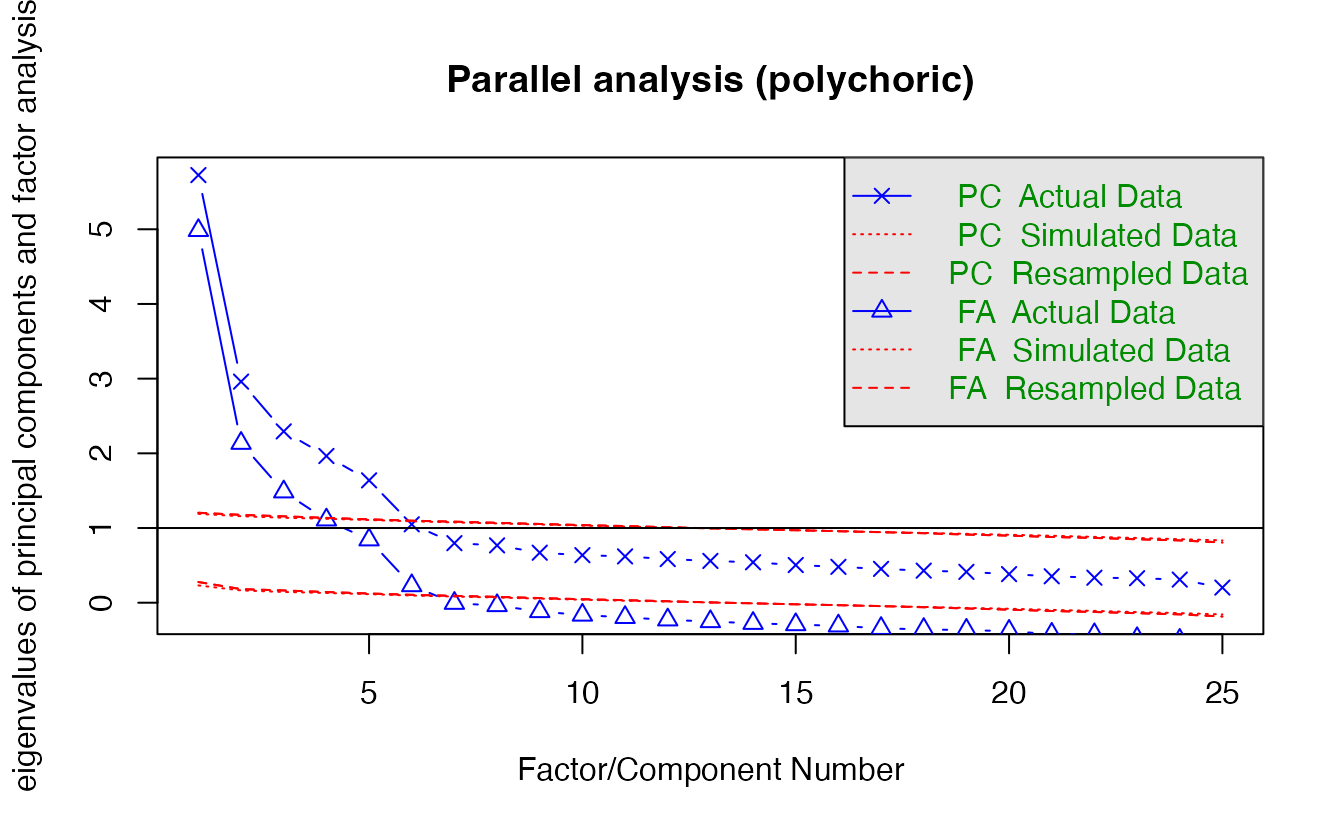
Parallel analysis suggests 6 factors (and 5 components).
When the data disagree with theory
The questionnaire was designed to measure five traits. If parallel analysis suggests a different number (with large samples it often suggests six for these items — the psych documentation notes that the suggested number for bfi grows with sample size), what should you do?
- Remember what parallel analysis is: a rule of thumb, not a test of the true number. With large \(n\), random eigenvalues get very close to 1, so even small “minor” factors (e.g. two items with similar wording) pass the threshold.
- Fit both solutions (5 and 6 factors) and compare them: is the extra factor interpretable? Does it have at least three items with substantial loadings, or is it a “doublet” of two items? Does it split a known trait into two meaningful facets?
- Choose the solution you can defend on theoretical and empirical grounds, and report what the alternatives looked like.
For the Big Five, the theory is strong and the sixth factor (if any) tends to be a small one, so we continue with five factors — and you will look at the six-factor solution in Exercise 4.
7. Fitting the model
fa5 <- fa(bfi_items,
          nfactors = 5,
          fm       = "minres",     # minimum residual extraction
          rotate   = "oblimin",    # oblique rotation: factors may correlate
          cor      = "poly")       # polychoric correlations
Why an oblique rotation?
The raw (“unrotated”) solution is mathematically valid but hard to interpret. Rotation turns the factor axes to obtain simple structure: each item loads strongly on one factor and weakly on the others.
- Orthogonal rotations (e.g.
"varimax") force factors to be uncorrelated. - Oblique rotations (e.g.
"oblimin","promax") allow correlations between factors.
Personality traits are correlated in real people (e.g. emotional stability and conscientiousness). Forcing them to be uncorrelated distorts the loadings. An oblique rotation lets the data decide: if the factors are in fact uncorrelated, oblimin will return nearly the same solution as varimax. So oblique rotation is the sensible default for psychological traits.
Loadings
print(fa5$loadings, cutoff = 0.3, sort = TRUE)#>
#> Loadings:
#> MR2 MR3 MR4 MR1 MR5
#> N1 0.865
#> N2 0.811
#> N3 0.739
#> N4 0.502 -0.408
#> N5 0.517
#> E1 -0.589
#> E2 -0.703
#> E4 0.631
#> C1 0.588
#> C2 0.705
#> C3 0.606
#> C4 -0.688
#> C5 -0.598
#> A2 0.704
#> A3 0.704
#> A5 0.564
#> O1 0.573
#> O2 -0.503
#> O3 0.660
#> O5 -0.593
#> A1 -0.496
#> A4 0.474
#> E3 0.437 0.322
#> E5 0.448
#> O4 -0.368 0.445
#>
#> MR2 MR3 MR4 MR1 MR5
#> SS loadings 2.752 2.224 2.241 2.132 1.876
#> Proportion Var 0.110 0.089 0.090 0.085 0.075
#> Cumulative Var 0.110 0.199 0.289 0.374 0.449psych names factors after the extraction method — MR1, MR2, … for minres, ML1, ML2, … for maximum likelihood, PA1, … for principal axis — and orders them by the variance they explain, so the numbers do not follow the order A, C, E, N, O. Let’s find out which trait each factor represents by checking which group of items loads most on it:
L <- unclass(fa5$loadings)
trait <- substr(rownames(L), 1, 1)          # "A", "C", "E", "N", "O"
factor_trait <- apply(abs(L), 2, \(l) names(which.max(tapply(l, trait, mean))))
factor_trait
#> MR2 MR3 MR4 MR1 MR5
#> "N" "E" "C" "A" "O"
TipHow to read the loadings
- Each number is a pattern loading: the direct effect of the factor on the item, controlling for the other factors. Loadings below 0.3 in absolute value are hidden to reveal the structure.
- Each factor collects the items of one trait: MR2 = N, MR3 = E, MR4 = C, MR1 = A, MR5 = O.
- Negative loadings belong to reverse-keyed items (e.g. A1, C4, C5, E1, E2): they are not a problem, they show that the item measures the opposite pole.
- An item with two loadings above 0.3 is a cross-loading item: it is less clean as a measure of one trait.
Communalities and uniquenesses
data.frame(h2 = round(fa5$communality, 2),
           u2 = round(fa5$uniquenesses, 2)) |>
  arrange(h2) |>
  head(5)
#> h2 u2
#> A1 0.26 0.74
#> O2 0.30 0.70
#> A4 0.35 0.65
#> O4 0.35 0.65
#> C3 0.36 0.64The mean communality is 0.48: on average the five factors explain about 48% of the variance of an item. This is typical for single personality items, which contain a lot of item-specific variance and noise. Items with very low \(h^2\) are weakly related to the factors.
Factor correlations
Phi <- fa5$Phi
dimnames(Phi) <- list(factor_trait, factor_trait)
round(Phi, 2)
#> N E C A O
#> N 1.00 -0.21 -0.19 -0.06 0.01
#> E -0.21 1.00 0.25 0.32 0.15
#> C -0.19 0.25 1.00 0.22 0.21
#> A -0.06 0.32 0.22 1.00 0.20
#> O 0.01 0.15 0.21 0.20 1.00The factor correlation matrix \(\Phi\) exists only for oblique rotations. The largest correlation (in absolute value) is 0.32. These correlations are moderate rather than zero — which is precisely why an orthogonal rotation would be a poor fit to the theory.
8. How well does the model fit?
c(TLI   = fa5$TLI,
  RMSEA = unname(fa5$RMSEA[1]),
  RMSR  = fa5$rms)
#> TLI RMSEA RMSR
#> 0.85567 0.06729 0.03008
TipHow to read the fit indices
Conventional guidelines (e.g. Hu & Bentler, 1999), to be used cautiously — they were developed for confirmatory models with continuous data and are rough guides in exploratory analysis:
| Index | Measures | Commonly read as acceptable | Good |
|---|---|---|---|
| RMSEA (root mean square error of approximation) | misfit per degree of freedom | < 0.08 | < 0.06 (≤ 0.05 “close”) |
| TLI (Tucker–Lewis index) and CFI (comparative fit index) | improvement over a null model of no correlations | ≥ 0.90 | ≥ 0.95 |
| RMSR (root mean square residual) | average residual correlation | < 0.08 | < 0.05 |
Here TLI = 0.86 and RMSEA = 0.067. psych does not report CFI for fa(); it is standard output of confirmatory factor analysis software such as lavaan. With polychoric correlations these indices are only approximate. Here TLI is below the 0.90 guideline. Exploratory models of single personality items often fit only moderately, because items have many small secondary associations (similar wording, minor facets) that a five-factor model does not capture; judge fit together with interpretability and residuals, not by a single cut-off.
To compare, fit the same model with an orthogonal rotation and maximum likelihood:
fa5_ml_vmx <- fa(bfi_items, nfactors = 5, fm = "ml",
                 rotate = "varimax", cor = "poly")
colnames(fa5_ml_vmx$loadings)               # ML1, ML2, ... for maximum likelihood
#> [1] "ML1" "ML2" "ML3" "ML5" "ML4"The fit indices of an orthogonal and an oblique rotation of the same extraction are identical — rotation does not change how well the model reproduces the correlations, only how the factors are described. What changes is interpretability and whether factor correlations are allowed.
9. Factor scores
Each person’s estimated position on each factor:
scores <- fa5$scores
colnames(scores) <- factor_trait[colnames(scores)]
head(round(scores, 2), 3)
#> N E C A O
#> 61617 -0.20 0.06 -1.46 -0.95 -1.79
#> 61618 0.14 0.48 -0.64 -0.06 -0.29
#> 61620 0.66 0.16 -0.07 -0.68 0.22Factor scores are estimates (several methods exist; the default is “regression”). They are useful for exploration, but in research it is common to use simple sum or mean scores of the items of each scale (after reversing the reverse-keyed items), or to model the latent variables directly in a structural equation model.
10. Reliability: Cronbach’s α and McDonald’s ω
Once you know which items form a scale, check its internal consistency — how consistently the items measure the same thing.
consc <- bfi_items[, paste0("C", 1:5)]
alpha_c <- psych::alpha(consc, keys = c("C4", "C5"))   # reverse C4 and C5
alpha_c$total[, c("raw_alpha", "std.alpha", "average_r")]
#> raw_alpha std.alpha average_r
#> 0.7373 0.7409 0.3638The keys argument tells alpha() which items to reverse before combining them. Forgetting it makes α artificially low (or even negative), because reverse-keyed items then pull in the opposite direction; psych warns you if some items correlate negatively with the total.
Cronbach’s α = 0.74. Values around 0.7–0.8 are usually considered adequate for research scales. α assumes that all items load equally on the factor (tau-equivalence); when loadings differ, it underestimates reliability. McDonald’s ω total uses the factor loadings and does not need this assumption:
omega_c <- psych::omega(consc, nfactors = 1, key = c(1, 1, 1, -1, -1),
                        plot = FALSE)
omega_c$omega.tot
#> [1] 0.742ω total is 0.74. (With one factor, ω hierarchical is not meaningful and psych tells you so; for multi-factor questionnaires, omega() with 3 or more group factors also reports ω hierarchical, the share of variance due to a general factor.)
WarningCommon pitfalls
- Using varimax for traits that are expected to correlate. Prefer an oblique rotation (oblimin); it reduces to an orthogonal solution if the factors are in fact uncorrelated.
- Pearson correlations on few-category Likert items. They attenuate correlations; use
cor = "poly". - Letting one rule decide the number of factors. Parallel analysis, scree, theory and interpretability should be weighed together — and alternatives reported.
- Applying fit-index cut-offs mechanically (or using invented ones such as “TLI > 0.88 is excellent”). Use conventional guides (RMSEA < .06–.08, TLI/CFI ≥ .90–.95) with caution.
- Forgetting reverse-keyed items when computing α or sum scores.
- Calling PCA “factor analysis”. PCA summarises total variance; FA models common variance with an explicit error term.
11. Check your understanding
12. Exercises
★ Exercise 1 — one factor in base R. Using the simulated items from section 2, (a) compute the communalities from factanal() (hint: 1 - fa_1$uniquenesses) and compare them with the squared true loadings; (b) explain in one sentence why item 5 has the smallest communality.
TipSolution
data.frame(true_h2 = true_load^2,
           estimated_h2 = round(1 - fa_1$uniquenesses, 2))
The estimates are close to 0.64, 0.49, 0.36, 0.25, 0.16 (sampling error makes them differ slightly). Item 5 has the weakest true loading (0.4), so only 16% of its variance comes from the factor; the rest is noise.
★ Exercise 2 — predict. You fit fa(bfi_items, 5, rotate = "varimax", cor = "poly") and fa(bfi_items, 5, rotate = "oblimin", cor = "poly"). Without running: (a) which output contains a factor correlation matrix Phi? (b) will the two TLI values differ? (c) will the loadings differ?
TipSolution
- Only the oblimin solution (varimax factors are uncorrelated by construction). (b) No — same extraction, same fit. (c) Yes, somewhat: oblimin loadings are cleaner when factors truly correlate, because the varimax solution must express shared variance between traits as cross-loadings.
★★ Exercise 3 — debug the reliability. A student computes the reliability of the Agreeableness scale and gets a surprisingly low α with a warning about negatively correlated items:
psych::alpha(bfi_items[, paste0("A", 1:5)])Explain the problem and fix it.
TipSolution
A1 (“Am indifferent to the feelings of others”) is reverse-keyed and correlates negatively with the other items. Reverse it:
psych::alpha(bfi_items[, paste0("A", 1:5)], keys = "A1")α increases noticeably once A1 is scored in the right direction. (check.keys = TRUE would reverse it automatically, but specifying the keys from the questionnaire’s documentation is safer.)
★★ Exercise 4 — five or six? Fit a six-factor solution (fm = "minres", rotate = "oblimin", cor = "poly"). Print the loadings with cutoff = 0.3. Which items load on the sixth factor? Is it a meaningful trait, a facet of an existing trait, or a minor factor? Which solution would you report, and why?
TipSolution
fa6 <- fa(bfi_items, nfactors = 6, fm = "minres",
          rotate = "oblimin", cor = "poly")
print(fa6$loadings, cutoff = 0.3, sort = TRUE)
c(TLI5 = fa5$TLI, TLI6 = fa6$TLI)
Fit always improves a little with more factors. Look at the extra factor: typically it has only a few items with modest loadings (often a subset of Openness or Extraversion items), and most of the five-factor structure is unchanged. If the sixth factor is weak, has fewer than three salient items and lacks a clear theoretical meaning, the five-factor solution is easier to defend — but report that parallel analysis suggested six and what the sixth factor looked like.
★★★ Exercise 5 — mini-analysis on a short scale. Take only the 10 Neuroticism and Extraversion items (N1–N5, E1–E5). (a) Run a parallel analysis with polychoric correlations. (b) Fit a two-factor oblique solution and interpret the loadings. (c) What is the correlation between the two factors? (d) Compute α for each scale (remember the reverse-keyed E1 and E2).
TipSolution
ne <- bfi_items[, c(paste0("N", 1:5), paste0("E", 1:5))]

set.seed(1)
fa.parallel(ne, fa = "fa", cor = "poly", n.iter = 20)

fa2 <- fa(ne, nfactors = 2, fm = "minres", rotate = "oblimin",
          cor = "poly")
print(fa2$loadings, cutoff = 0.3)
round(fa2$Phi, 2)

psych::alpha(ne[, paste0("N", 1:5)])$total$raw_alpha
psych::alpha(ne[, paste0("E", 1:5)], keys = c("E1", "E2"))$total$raw_alpha
The N items load on one factor and the E items on the other, with E1 and E2 negative. The two factors are only weakly correlated (check the sign and size in Phi). Both scales typically have α above 0.75. Parallel analysis usually suggests two factors, possibly more with this large sample.
Summary
| Idea / function | What it does |
|---|---|
| \(X = \Lambda F + \varepsilon\) | items = loadings × latent factors + unique part |
polychoric(x)$rho |
correlations for ordinal (Likert) items |
KMO(), cortest.bartlett() |
factorability checks |
fa.parallel(x, cor = "poly") |
parallel analysis for the number of factors |
fa(x, nfactors, fm = "minres", rotate = "oblimin", cor = "poly") |
exploratory factor analysis |
$loadings, $communality, $uniquenesses, $Phi |
pattern loadings, \(h^2\), \(u^2\), factor correlations |
$TLI, $RMSEA, $rms |
fit indices |
alpha(x, keys = ), omega(x) |
reliability (α, ω), with reverse-keyed items |
- FA explains common variance through latent factors; PCA summarises total variance.
- Use polychoric correlations for Likert items and an oblique rotation for traits that may correlate.
- Decide the number of factors with parallel analysis and theory, and report alternatives.
- Read fit indices with conventional, cautious thresholds; rotation does not change fit.
- Check reliability with α and ω, after reversing reverse-keyed items.