library(dplyr)
library(ggplot2)
library(ca)Correspondence analysis
A map of the associations in a contingency table — and how to read it correctly
Learn row and column profiles, masses and inertia, run correspondence analysis with ca::ca(), build a correct symmetric map with principal coordinates, and interpret contributions and quality of representation.
NoteLearning objectives
By the end of this lesson you will be able to:
- describe a contingency table through row and column profiles, masses and inertia (\(\chi^2 / n\));
- explain correspondence analysis (CA) as a “PCA for tables” and run it with
ca::ca(); - distinguish standard and principal coordinates and draw a correct symmetric map;
- use contributions and quality of representation (cos²) to decide what a map can tell you;
- interpret a CA map without the usual mistakes.
1. Why correspondence analysis?
In Proportions and the chi-square test you learnt to ask “are hair colour and eye colour associated?” The chi-square test answers yes or no. But it does not say which hair colours go with which eye colours, nor how the categories relate to each other.
Correspondence analysis (CA) turns a contingency table into a map: categories with similar profiles are drawn close together, and the main patterns of association become directions on the map. It is to a table of counts what PCA is to a table of measurements.
2. The data and the chi-square test
HairEyeColor cross-classifies 592 students by hair colour, eye colour and sex. We collapse over sex:
hair_eye <- margin.table(HairEyeColor, margin = c(1, 2))
hair_eye
#> Eye
#> Hair Brown Blue Hazel Green
#> Black 68 20 15 5
#> Brown 119 84 54 29
#> Red 26 17 14 14
#> Blond 7 94 10 16chi <- chisq.test(hair_eye)
chi#>
#> Pearson's Chi-squared test
#>
#> data: hair_eye
#> X-squared = 138, df = 9, p-value <2e-16The test gives \(\chi^2 =\) 138.3 with 9 degrees of freedom (\((4-1)(4-1)\)): overwhelming evidence of association. The Pearson residuals (observed − expected) / √expected show where the association lies:
round(chi$residuals, 1)#> Eye
#> Hair Brown Blue Hazel Green
#> Black 4.4 -3.1 -0.5 -2.0
#> Brown 1.2 -1.9 1.4 -0.3
#> Red -0.1 -1.7 0.9 2.3
#> Blond -5.9 7.0 -2.2 0.6Large positive residuals (Blond–Blue, Black–Brown) mark combinations that occur much more often than independence would predict. CA will summarise this whole table of residuals in a picture.
3. Profiles, masses and inertia
CA works with proportions, not counts.
- A row profile is a row divided by its total: the distribution of eye colours within one hair colour.
- The average row profile (the column margins) is the distribution of eye colours in the whole sample.
round(prop.table(hair_eye, margin = 1), 2) # row profiles#> Eye
#> Hair Brown Blue Hazel Green
#> Black 0.63 0.19 0.14 0.05
#> Brown 0.42 0.29 0.19 0.10
#> Red 0.37 0.24 0.20 0.20
#> Blond 0.06 0.74 0.08 0.13round(prop.table(margin.table(hair_eye, 2)), 2) # average profile#> Eye
#> Brown Blue Hazel Green
#> 0.37 0.36 0.16 0.11Blond-haired students have a very different profile from the average (74% blue eyes versus 36% overall), while brown-haired students are close to the average.
- The mass of a row is its share of the total (\(n_{i+}/n\)). Heavy rows (many people) weigh more in the analysis.
- The inertia of a table measures how far the profiles are, on average, from the average profile. It equals
\[ \text{total inertia} = \frac{\chi^2}{n}. \]
n <- sum(hair_eye)
unname(chi$statistic / n)
#> [1] 0.2336If hair and eye colour were independent, every row profile would equal the average profile and the inertia would be 0. CA decomposes this inertia into dimensions, just as PCA decomposes variance into components.
NoteGoing deeper: chi-square distances
The distance between a row profile \(a_i\) and the average profile \(c\) is the chi-square distance
\[ d^2(a_i, c) = \sum_j \frac{(a_{ij} - c_j)^2}{c_j}. \]
Dividing by \(c_j\) gives more weight to differences in rare columns. The total inertia is the mass-weighted average of these squared distances: \(\sum_i r_i \, d^2(a_i, c) = \chi^2/n\), where \(r_i\) is the row mass. The same holds for columns.
4. Running CA
ca_he <- ca(hair_eye)
ca_he
#>
#> Principal inertias (eigenvalues):
#> 1 2 3
#> Value 0.208773 0.022227 0.002598
#> Percentage 89.37% 9.52% 1.11%
#>
#>
#> Rows:
#> Black Brown Red Blond
#> Mass 0.18243 0.48311 0.1199 0.2145
#> ChiDist 0.55119 0.15946 0.3548 0.8384
#> Inertia 0.05543 0.01228 0.0151 0.1508
#> Dim. 1 -1.10428 -0.32446 -0.2835 1.8282
#> Dim. 2 1.44092 -0.21911 -2.1440 0.4667
#>
#>
#> Columns:
#> Brown Blue Hazel Green
#> Mass 0.37162 0.3632 0.15710 0.10811
#> ChiDist 0.50049 0.5537 0.28865 0.38573
#> Inertia 0.09309 0.1113 0.01309 0.01608
#> Dim. 1 -1.07713 1.1981 -0.46529 0.35401
#> Dim. 2 0.59242 0.5564 -1.12278 -2.27412A 4 × 4 table has at most \(\min(4, 4) - 1 = 3\) dimensions. The principal inertias (eigenvalues) are the squared singular values:
eig <- ca_he$sv^2
data.frame(dim = seq_along(eig),
           inertia = round(eig, 4),
           percent = round(100 * eig / sum(eig), 1),
           cumulative = round(100 * cumsum(eig) / sum(eig), 1))
#> dim inertia percent cumulative
#> 1 1 0.2088 89.4 89.4
#> 2 2 0.0222 9.5 98.9
#> 3 3 0.0026 1.1 100.0
TipHow to read this output
- The inertias add up to the total inertia: 0.2336 = \(\chi^2/n\).
- Dimension 1 alone accounts for 89.4% of the inertia, dimension 2 for 9.5%. Together, a two-dimensional map shows 98.9% of the association in the table — almost all of it.
5. Standard versus principal coordinates
This is the point where most mistakes happen, so let’s be careful. ca() returns standard coordinates in rowcoord and colcoord. Each dimension of standard coordinates has (weighted) variance 1 — they do not reflect how important the dimension is.
Principal coordinates are standard coordinates multiplied by the singular value of each dimension:
\[ \text{principal} = \text{standard} \times \sqrt{\text{inertia of the dimension}}. \]
In principal coordinates, the spread of the points along each axis reflects the inertia of that axis, and the distances between rows (or between columns) approximate their chi-square distances.
row_pc <- sweep(ca_he$rowcoord, 2, ca_he$sv, `*`)   # principal coordinates
col_pc <- sweep(ca_he$colcoord, 2, ca_he$sv, `*`)
round(row_pc[, 1:2], 3)
#> Dim1 Dim2
#> Black -0.505 0.215
#> Brown -0.148 -0.033
#> Red -0.130 -0.320
#> Blond 0.835 0.070round(col_pc[, 1:2], 3)#> Dim1 Dim2
#> Brown -0.492 0.088
#> Blue 0.547 0.083
#> Hazel -0.213 -0.167
#> Green 0.162 -0.339The symmetric map — the standard CA plot — shows both rows and columns in principal coordinates. That is what plot() draws by default:
plot(ca_he, map = "symmetric")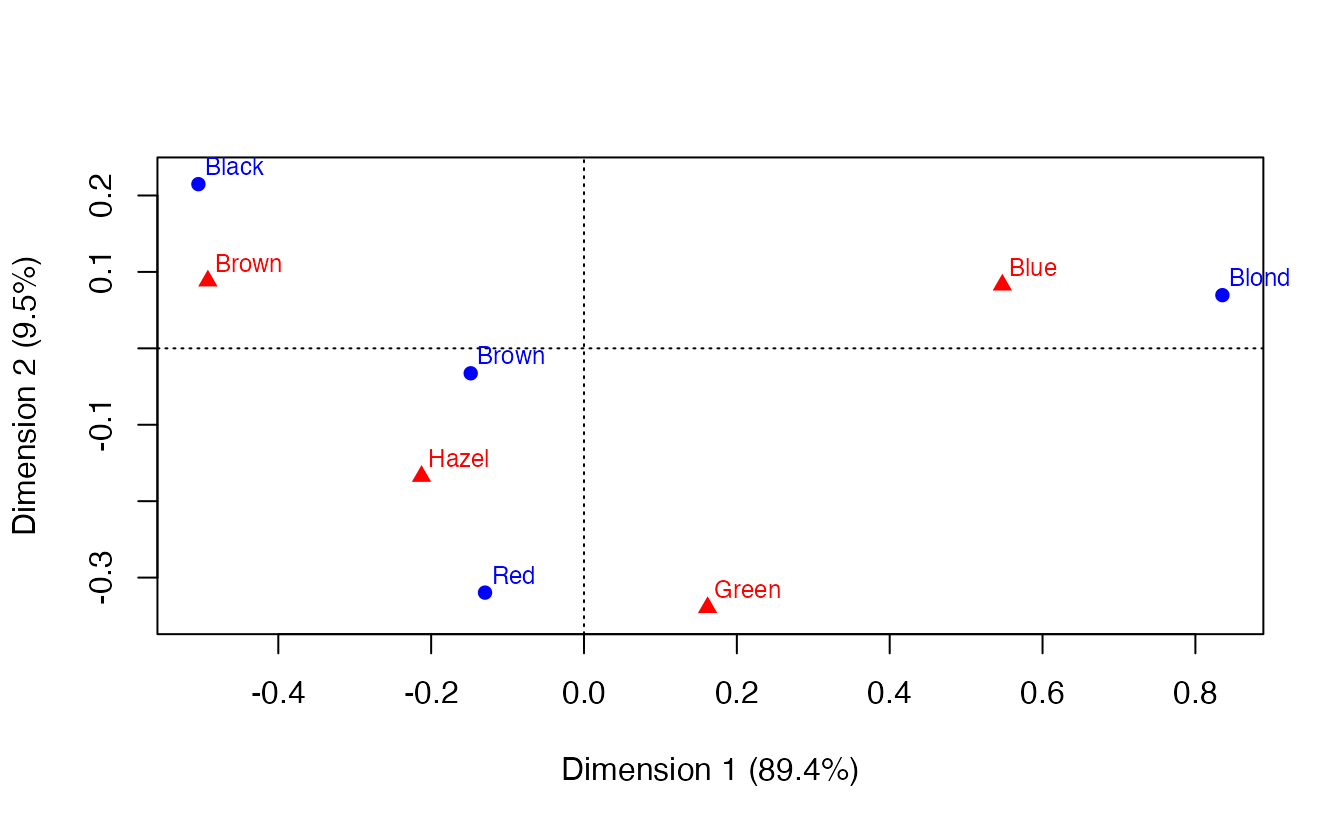
The same map with ggplot:
pct <- round(100 * eig / sum(eig), 1)

ca_map <- bind_rows(
  data.frame(label = ca_he$rownames, dim1 = row_pc[, 1], dim2 = row_pc[, 2],
             type = "Hair"),
  data.frame(label = ca_he$colnames, dim1 = col_pc[, 1], dim2 = col_pc[, 2],
             type = "Eye")
)

ggplot(ca_map, aes(dim1, dim2, colour = type, shape = type)) +
  geom_hline(yintercept = 0, colour = "grey70") +
  geom_vline(xintercept = 0, colour = "grey70") +
  geom_point(size = 3) +
  geom_text(aes(label = label), vjust = -0.9, show.legend = FALSE) +
  coord_equal() +
  labs(x = paste0("Dimension 1 (", pct[1], "%)"),
       y = paste0("Dimension 2 (", pct[2], "%)"),
       colour = NULL, shape = NULL)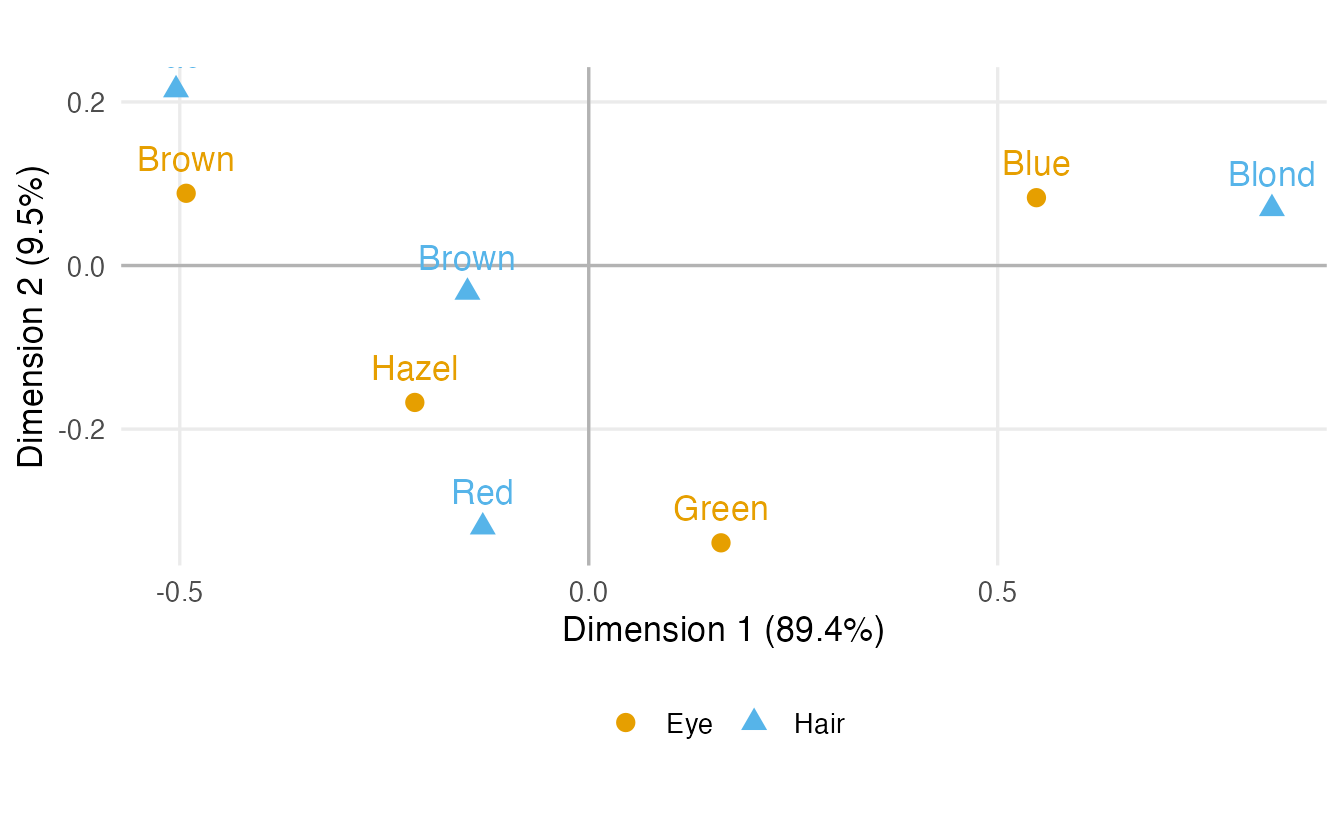
coord_equal() matters: one unit on each axis must have the same length, otherwise distances on the map are distorted.
NoteGoing deeper: CA as an SVD of standardised residuals
Let \(P = N/n\) be the table of proportions, \(r\) and \(c\) the row and column masses, and \(D_r = \mathrm{diag}(r)\), \(D_c = \mathrm{diag}(c)\). CA is the singular value decomposition of the matrix of standardised residuals
\[ S = D_r^{-1/2}\,(P - r c^\top)\,D_c^{-1/2} = U \Sigma V^\top . \]
Each element of \(S\) is a Pearson residual divided by \(\sqrt n\), so \(\sum_{ij} s_{ij}^2 = \chi^2/n\), and the squared singular values \(\sigma_k^2\) are the principal inertias. Then
- standard coordinates: rows \(D_r^{-1/2} U\), columns \(D_c^{-1/2} V\);
- principal coordinates: rows \(D_r^{-1/2} U \Sigma\), columns \(D_c^{-1/2} V \Sigma\).
We can verify it by hand:
P  <- hair_eye / n
rm <- rowSums(P)
cm <- colSums(P)
S  <- diag(1 / sqrt(rm)) %*% (P - rm %o% cm) %*% diag(1 / sqrt(cm))
s  <- svd(S)

s$d[1:3]^2                                # principal inertias
#> [1] 0.208773 0.022227 0.002598ca_he$sv^2 # same, from ca()#> [1] 0.208773 0.022227 0.002598all.equal(abs(diag(1 / sqrt(rm)) %*% s$u[, 1:3]),
abs(unname(ca_he$rowcoord))) # standard row coordinates#> [1] TRUE(As in PCA, the sign of each dimension is arbitrary, so we compare absolute values.)
6. Reading the map correctly
In a symmetric map, use these rules:
- Distances among rows (hair colours) approximate the chi-square distances between their profiles: hair colours close together have similar eye-colour distributions. The same holds among columns.
- Distance from the origin: the origin is the average profile. Categories far from the origin have profiles very different from the average; categories near the origin are “average”.
- Row–column relationships are read through directions, not distances: a row and a column that lie in the same direction from the origin, both far from it, are positively associated (more frequent together than expected); opposite directions mean they co-occur less than expected.
- Distances between a row point and a column point are not directly interpretable in a symmetric map. The two sets of points are on different scales. (The asymmetric maps,
plot(ca_he, map = "rowprincipal"), allow a stricter reading of row–column relations, at the cost of a less compact picture.)
TipWhat the hair–eye map shows
- Dimension 1 (89.4%) is a light–dark axis. Blond hair and blue eyes lie together at one end; black and, less extremely, brown hair lie with brown eyes at the other. This matches the largest residuals: Blond–Blue (7) and Black–Brown (4.4).
- Dimension 2 (9.5%) separates red hair and green (and partly hazel) eyes from black hair (residual Red–Green: 2.3).
- Brown hair is close to the origin: its eye-colour profile is close to the average, as we saw in the profiles.
Avoid reading quadrants as categories (“quadrant I = …”): the axes’ signs are arbitrary and the quadrants have no meaning in themselves.
7. Contributions and quality of representation
Two diagnostics help you decide which points drive a dimension and which points are faithfully shown.
- The contribution of a row to a dimension is the share of that dimension’s inertia due to the row: \(\text{mass} \times (\text{standard coordinate})^2\). Contributions to each dimension add up to 1.
- The quality of representation of a row on a dimension (cos²) is the share of the row’s own inertia that the dimension shows: \((\text{principal coordinate})^2 / (\text{chi-square distance to the centroid})^2\). Summed over dimensions 1 and 2 it tells you how well the point is represented on the map (1 = perfectly).
row_ctr  <- ca_he$rowmass * ca_he$rowcoord[, 1:2]^2
row_cos2 <- row_pc[, 1:2]^2 / ca_he$rowdist^2
col_ctr  <- ca_he$colmass * ca_he$colcoord[, 1:2]^2
col_cos2 <- col_pc[, 1:2]^2 / ca_he$coldist^2

round(cbind(ctr = row_ctr, cos2 = row_cos2, quality = rowSums(row_cos2)), 3)
#> Dim1 Dim2 Dim1 Dim2 quality
#> Black 0.222 0.379 0.838 0.152 0.990
#> Brown 0.051 0.023 0.864 0.042 0.906
#> Red 0.010 0.551 0.133 0.812 0.945
#> Blond 0.717 0.047 0.993 0.007 1.000round(cbind(ctr = col_ctr, cos2 = col_cos2, quality = rowSums(col_cos2)), 3)#> Dim1 Dim2 Dim1 Dim2 quality
#> Brown 0.431 0.130 0.967 0.031 0.998
#> Blue 0.521 0.112 0.977 0.022 1.000
#> Hazel 0.034 0.198 0.542 0.336 0.879
#> Green 0.014 0.559 0.176 0.773 0.948summary() reports the same quantities, multiplied by 1000 (per mille):
summary(ca_he)#>
#> Principal inertias (eigenvalues):
#>
#> dim value % cum% scree plot
#> 1 0.208773 89.4 89.4 **********************
#> 2 0.022227 9.5 98.9 **
#> 3 0.002598 1.1 100.0
#> -------- -----
#> Total: 0.233598 100.0
#>
#>
#> Rows:
#> name mass qlt inr k=1 cor ctr k=2 cor ctr
#> 1 | Blck | 182 990 237 | -505 838 222 | 215 152 379 |
#> 2 | Brwn | 483 906 53 | -148 864 51 | -33 42 23 |
#> 3 | Red | 120 945 65 | -130 133 10 | -320 812 551 |
#> 4 | Blnd | 215 1000 646 | 835 993 717 | 70 7 47 |
#>
#> Columns:
#> name mass qlt inr k=1 cor ctr k=2 cor ctr
#> 1 | Brwn | 372 998 398 | -492 967 431 | 88 31 130 |
#> 2 | Blue | 363 1000 477 | 547 977 521 | 83 22 112 |
#> 3 | Hazl | 157 879 56 | -213 542 34 | -167 336 198 |
#> 4 | Gren | 108 948 69 | 162 176 14 | -339 773 559 |
TipHow to read
summary()
mass— share of the total;qlt— quality of representation in the dimensions shown (sum of cos²);inr— share of the total inertia due to this point.- For each dimension
k: the principal coordinate,cor(cos², quality on that dimension) andctr(contribution to the dimension). - Dimension 1 is mainly driven by Blond (contribution 717‰) and, among eye colours, by Blue and Brown (521 and 431‰). Dimension 2 is driven by Red hair and Green eyes.
- All points are well represented on the 2-D map; the weakest is Hazel (quality 0.88), which still has part of its inertia on dimension 3.
A point with low quality should not be interpreted from its position on the map: it may look close to another point only because the difference between them lies in a dimension that is not shown.
8. Beyond two variables: multiple correspondence analysis
With more than two categorical variables (e.g. hair, eye and sex, or the answers to a whole survey), use multiple correspondence analysis (MCA). MCA needs one row per individual:
he_df <- as.data.frame(HairEyeColor)
people <- he_df[rep(seq_len(nrow(he_df)), he_df$Freq), c("Hair", "Eye", "Sex")]

mca_fit <- FactoMineR::MCA(people, graph = FALSE)
plot(mca_fit, invisible = "ind")    # show only the categories
(Not run here; it requires the FactoMineR package.) The reading rules are the same as for CA, but the percentages of inertia in MCA are known to be pessimistic, so they should not be compared with those of simple CA.
WarningCommon pitfalls
- Plotting standard coordinates (
rowcoord,colcoord) as if they were the map. Multiply by the singular values (principal coordinates), or useplot(ca_obj). - Interpreting the distance between a row point and a column point in a symmetric map. Read row–column associations through directions from the origin.
- Interpreting quadrants or the sign of an axis. Signs are arbitrary.
- Interpreting badly represented points (low quality / cos²) from their map position.
- Calling “contributions” what are in fact coordinates — contributions are mass × standard coordinate², and they add up to 1 per dimension.
- Clustering CA coordinates without a reason. CA is descriptive; if you want groups of categories, say why and use the chi-square distances, not an arbitrary algorithm on a handful of points.
9. Check your understanding
10. Exercises
★ Exercise 1 — predict, then check. Collapse HairEyeColor to the Hair × Sex table. (a) How many CA dimensions will it have? (b) Compute its total inertia as \(\chi^2/n\). (c) What percentage of inertia will dimension 1 explain?
TipSolution
hair_sex <- margin.table(HairEyeColor, c(1, 3))
unname(chisq.test(hair_sex)$statistic / sum(hair_sex))   # about 0.0135
ca(hair_sex)$sv^2- \(\min(4, 2) - 1 = 1\) dimension. (b) About 0.0135 — far smaller than for hair × eye (≈ 0.23): sex and hair colour are only weakly associated. (c) With a single dimension it explains 100% of the inertia.
★★ Exercise 2 — debug the map. This code draws a “CA map” for hair_eye. What is wrong with it, and how do you fix it?
ca_he <- ca(hair_eye)
plot(rbind(ca_he$rowcoord[, 1:2], ca_he$colcoord[, 1:2]), type = "n")
text(ca_he$rowcoord[, 1:2], ca_he$rownames, col = "blue")
text(ca_he$colcoord[, 1:2], ca_he$colnames, col = "red")
TipSolution
It plots standard coordinates, which give both dimensions the same spread although dimension 1 has about nine times more inertia than dimension 2. The axes are also not on the same scale. Use principal coordinates and an aspect ratio of 1:
rp <- sweep(ca_he$rowcoord[, 1:2], 2, ca_he$sv[1:2], `*`)
cp <- sweep(ca_he$colcoord[, 1:2], 2, ca_he$sv[1:2], `*`)
plot(rbind(rp, cp), type = "n", asp = 1)
text(rp, ca_he$rownames, col = "blue")
text(cp, ca_he$colnames, col = "red")
or simply plot(ca_he).
★★ Exercise 3 — contributions by hand. For the hair–eye CA, verify that (a) the contributions of the four hair colours to dimension 1 add up to 1; (b) the principal inertia of dimension 1 equals the mass-weighted sum of the squared principal coordinates of the rows.
TipSolution
sum(ca_he$rowmass * ca_he$rowcoord[, 1]^2)              # 1
row_pc <- ca_he$rowcoord[, 1] * ca_he$sv[1]
c(sum(ca_he$rowmass * row_pc^2), ca_he$sv[1]^2)         # equal, about 0.209
Standard coordinates are normalised so that their weighted sum of squares is 1 on every dimension; multiplying by the singular value rescales it to the dimension’s inertia.
★★ Exercise 4 — interpret. In the summary of the hair–eye CA, Hazel has the lowest quality on the 2-D map, with part of its inertia (about 12%) on dimension 3. What does this imply for statements such as “hazel eyes are halfway between brown and green eyes”?
TipSolution
Part of what distinguishes the hazel profile is not visible in the plane of dimensions 1–2. Its position on the map is still informative (its quality is fairly high, about 0.88), but fine statements about its exact position relative to other points should be made cautiously. Check qlt before interpreting a point, and look at dimension 3 (plot(ca_he, dim = c(1, 3))) if needed.
★★★ Exercise 5 — mini-analysis. The smoke data in the ca package cross-classify 193 employees of a fictitious company by staff group (senior/junior managers and employees, secretaries) and smoking intensity. (a) Run a chi-square test. (b) Run CA and report the percentage of inertia of the first two dimensions. (c) Draw the symmetric map and describe the main pattern. (d) What does the chi-square test result suggest about how much to trust that pattern?
TipSolution
data(smoke, package = "ca")
chisq.test(smoke)           # warning: some expected counts are small
ca_smoke <- ca(smoke)
round(100 * ca_smoke$sv^2 / sum(ca_smoke$sv^2), 1)
plot(ca_smoke)
summary(ca_smoke)
The test gives \(\chi^2 \approx 16.4\) with 12 df, p ≈ 0.17: no significant association, and R warns that some expected counts are small. CA still runs: dimension 1 explains about 88% of the inertia and opposes non-smokers (with senior employees, SE, and secretaries, SC) to smokers (with junior groups, JM and JE). But with so little evidence of association overall, this pattern is a description of this sample that may not replicate. CA is descriptive; it does not replace the test.
Summary
| Idea / function | What it does |
|---|---|
margin.table(x, c(1, 2)) |
collapse a multi-way table to two variables |
prop.table(tab, 1) |
row profiles |
| \(\chi^2 / n\) | total inertia: how far the profiles are from independence |
ca(tab) |
correspondence analysis (sv, rowcoord, colcoord, masses, distances) |
ca_obj$sv^2 |
principal inertias (eigenvalues) |
standard × sv |
principal coordinates |
plot(ca_obj) |
symmetric map (both sets in principal coordinates) |
summary(ca_obj) |
mass, quality, inertia, coordinates, cos², contributions (×1000) |
FactoMineR::MCA() |
multiple CA for several categorical variables |
- CA decomposes the inertia \(\chi^2/n\) of a table into a few dimensions.
- A correct symmetric map uses principal coordinates for rows and columns, with equal axis scales.
- Interpret distances among rows and among columns; read row–column association through directions from the origin.
- Use contributions to name the dimensions and quality (cos²) to decide which points can be interpreted.